Introduction
Contents
Introduction
We ran a survey from the snowmass community that officially closed on Feburary 9th. These pages attempt to summarize the wealth of information the community provided. A huge thank you to everyone that responded - many of you took the time to provide us with detailed comments. There is no way this set of pages can do justice to all the information that was given to us!
This introduction page gives some very high level results and some conclusions that we are taking away from this (and potential action items for the Snowmass community and summer workshop organizers). The other pages delve into the details. While US centric, many of the responses are likely relavent for others planning a workshop.
from config import survey
import matplotlib.pyplot as plt
import pandas as pd
import altair as alt
Collecting the results
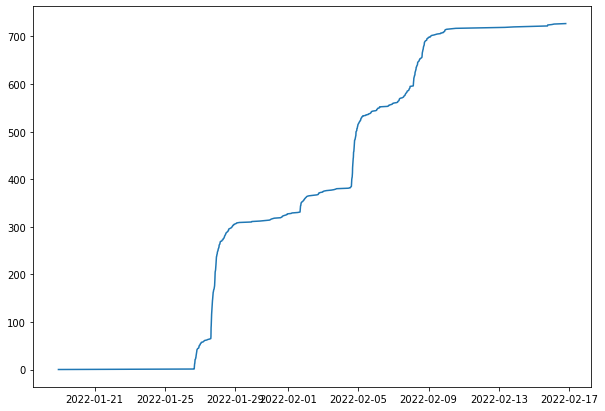
First - how many people answered and how did they answer over time?
print(f'Number of people that responded: {len(survey)}')
Number of people that responded: 728
plt.plot(pd.to_datetime(survey.time), range(len(survey)))
plt.show()
The call went out to the snowmass community:
Several emails were sent by snowmass frontier conveeners to their global mailing lists
A final email was sent to the full snowmass email list (about 1500 people).
This puts our response rate at about 50%, which is remarkable.
How big should the summer study workshop be?
Perhaps the most important question how large should it be?
attend_histo = (
    alt.Chart(data=survey, title="Would you attend?")
       .transform_joinaggregate(total='count(*)')
       .transform_calculate(pct='1 / datum.total')
       .mark_bar()
       .encode(
           x=alt.X(shorthand="count(attend)"),
           y=alt.Y(shorthand="attend:N", title="", sort="-x")
       )
)
attend_text = (
    attend_histo.mark_text(align="right", dx=-3)
                .encode(
                    text=alt.Text("sum(pct):Q", format=".0%"),
                    color=alt.value("white")
                )
)

attend_histo + attend_text
730 people replied, and about 50% would attend if they could. It is likely the “Would Attend” rate is lower in the second half of the snowmass mailing list that didn’t reply. That puts us at 350 people that would attend if they could.
We will aim for a conference that will break even at 400 people, with the ability to expand if needed.
Attendance
This summarizes some conclusiosn pulled from the Attendance chapter:
Accross the board, about 50% of each rank population would like to attend. There is surprisingly little variation.
Interestingly, more people from labs want to come than from US Universities. And similar with Canada - those from Canada that answered the survey are highly motivated to attend.
Looking at some of the comments we find:
COVID and funding are mentioned a lot in the comments!
Lots of references to how well the meeting worked last time and a desire to repeat the experience.
DOE and its travel policy are a signifincat worry. This appears repeatedly through all aspects of the survey.
A lot of people indicated they had other responsibilities that conflicted with this meeting.
Ranking concerns, the order is COVID, Responsibilities, Funding, Length, and Accessability.
Length of the workshop is a real worry - we have not made a good enough case for the workshop to be longer than a week (comments mentioned 3 days should be enough for what needs to be done).
For those that wish to attend, 80% are interested in the dinner.
Demographics
This summarizes some conclusions pulled from the Demographics chapter
Most people consider more than one frontier to be their primary interest: cross-frontier meetings will likely be very important
323 indicated that EF was their primary interest, with CF being the next most popular at 220.
Most correlated frontiers are (IF, NF, UF) and (CF, TF) and (CommF, CompF) and (EF, AF) and (EF, TF)
COVID
The COVID chapter contains a discussion of the COVID specific questions. It should be noted that COVID touches on almost everyone’s answers and comments all the way through the responses.
COVID is was singled out as the largest worry
However, when asked to specify what infection level people would be comfortable with, Institute Travel Restrictions were singled out. Slicing the data by employee location we see people at the DOE labs are driving this.
A small number of people are not willing to travel under any circumstances (14 of the respondants,
`5%).
~10% would travel even at the hight of Omicron’s infection rate
At the summer low (was classified as point E on the plot (see the covid section)), about 70% would be willing to travel.
In the comments on this question:
Lots of worry about a new varrient
Rules on masks and cavvination for attendees
Masks should be availible
Requests for Seattle local vaccination rates, infection rates, etc.
Accomodation
Responses to the “Accommodations” section gave organizers information they needed to plan for accessibility at Snowmass.
16% of respondents indicated accessibility concerns could prevent or limit their participation in the Snowmass Summer Study.
Respondents described needs for hearing, visual, mobility, dietary, medical and other accommodations, as well as sufficient time and space for breaks and informal discussions.
In the “other” and free-response sections, respondents also indicated that financial, childcare, and schedule constraints were barriers to accessibility for them, and the ability to attend remotely was requested.
Notes
A few notes to help navagate this set of pages
All the code used to interpret the results can be observed so you can see exactly what we did.
If you really want to know the details, make sure to look at the
cleaningpage: there are a number of answers that were free form, and this is the page where we clean the data to attempt to rationalize it.Some plots are interactive - these come in pairs in this book. You can click on a histogram bar in the first plot and that will filter the data for the second plot!