Accessing the Trigger
Contents
Accessing the Trigger
In ATLAS all access to trigger data is via the Trigger Decision Tool (TDT). There is quite a bit of information attached to the trigger, and its layout is quite complex - for that reason one should use the TDT to access the data rather than attempting to do it directly (trust us…please…).
import matplotlib.pyplot as plt
from config import ds_zee as ds
from func_adl_servicex_xaodr21 import tdt_chain_fired, tmt_match_object
Looking for events that fired a chain
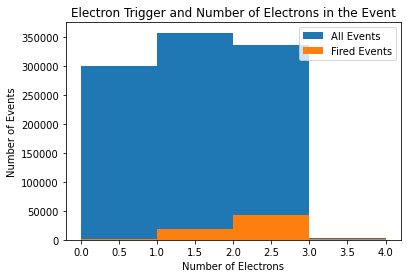
Lets look at \(Z \rightarrow ee\) Monte Carlo for a single electron trigger in the event.
n_electrons = (ds.Select(lambda e:
                            {
                                "n_ele": e.Electrons().Where(lambda e: abs(e.eta()) < 2.5).Count(),
                                "fired": tdt_chain_fired("HLT_e60_lhmedium_nod0"),
                            })
                .AsAwkwardArray()
                .value()
               )
plt.hist(n_electrons.n_ele, bins=4, range=(0, 4), label='All Events')
plt.hist(n_electrons.n_ele[n_electrons.fired], bins=4, range=(0, 4), label='Fired Events')
plt.xlabel('Number of Electrons')
plt.ylabel('Number of Events')
plt.title('Electron Trigger and Number of Electrons in the Event')
_ = plt.legend()

Trigger Matching
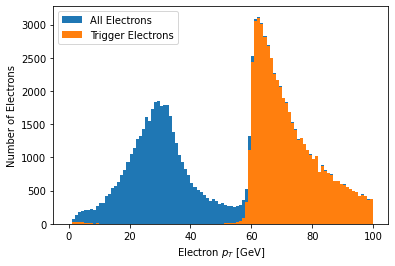
Next, let’s find the electrons that matched that trigger that fired above. We’ll do this by looking only at events where the trigger has fired, and then asking each electron if it matches withing a \(\Delta R\).
matched_electrons = (
    ds.Where(lambda e: tdt_chain_fired("HLT_e60_lhmedium_nod0"))
    .SelectMany(lambda e: e.Electrons())
    .Select(
        lambda e: {
            "pt": e.pt() / 1001.0,
            "eta": e.eta(),
            "is_trig": tmt_match_object("HLT_e60_lhmedium_nod0", e, 0.7),
        }
    )
    .AsAwkwardArray()
    .value()
)
To know the tnt_match_object arguments, you’ll need to look up its definition below on the atlas twiki.
plt.hist(matched_electrons.pt, bins=100, range=(0, 100), label='All Electrons')
trigger_electrons = matched_electrons[matched_electrons.is_trig]
plt.hist(trigger_electrons.pt, bins=100, range=(0, 100), label='Trigger Electrons')
plt.xlabel('Electron $p_T$ [GeV]')
plt.ylabel('Number of Electrons')
_ = plt.legend()

Further Information
Tutorial on trigger for analysis.
Trigger Group’s Trigger Analysis Tool twiki page (with a page devoted to the TDT).
Lowest un-prescaled triggers per data-taking period twiki.
